Argentina
Edition performance
Goals at each World Cup
Goals
Scoreless editions are included from historical appearances. Assists are available only in covered event-data editions.
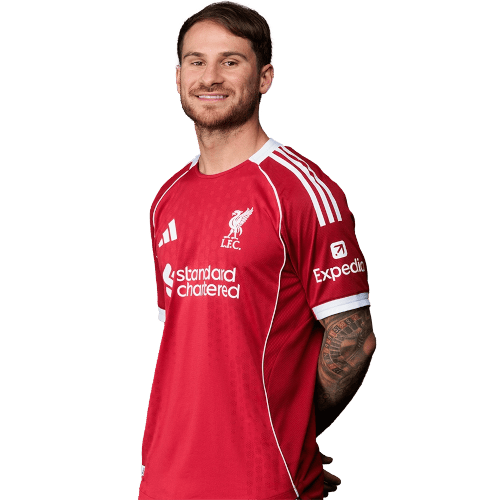
2026 runner-up
Goals at each World Cup
Scoreless editions are included from historical appearances. Assists are available only in covered event-data editions.
Goals + assists
Restricted to the 8 matches he appeared in
Goals per 90 minutes
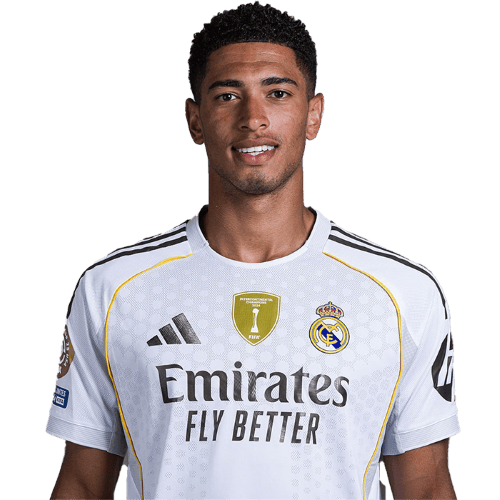 J. Bellingham1.02A. Mac Allister0.12
Alexis Mac Allister's 2026, moment by moment
Each bar fills to the share of the field he finished ahead of
By goal involvement in 2026
StatsBomb publish a full event feed for two men's World Cups, 2018 and 2022 — the only place expected goals, shot coordinates and passing volume exist on this site. Alexis Mac Allister played in 2022. No equivalent 2026 feed is loaded, so nothing here describes this tournament.
Data by StatsBomb
Bubble size is the chance's expected-goals value; filled bubbles are goals
Touch-weighted mean position, attacking left to right
937 touches recorded
Goals and saved shots as a share of all recorded attempts
Completed passes divided by attempted passes in covered editions
Body part recorded for goals in the covered editions
Every linked tournament appearance · filter by edition, opponent, stage, or result
| Edition / date | Stage | Opponent | Score | Min | G | A | Shots | On target | Result |
|---|---|---|---|---|---|---|---|---|---|
| 2026Jul 19 | Final |  Spain | 0–1 | 120 | 0 | 0 | 0 | 0 | L |
| 2026Jul 15 | Semi-final |  England | 2–1 | 90 | 0 | 0 | 3 | 1 | W |
| 2026Jul 12 | Quarter-final |  Switzerland | 3–1 | 120 | 1 | 0 | 4 | 1 | W |
| 2026Jul 7 | Round of 16 |  Egypt | 3–2 | 90 | 0 | 0 | 2 | 1 | W |
| 2026Jul 3 | Round of 32 |  Cape Verde | 3–2 | 120 | 0 | 1 | 2 | 0 | W |
| 2026Jun 28 | Group stage |  Jordan | 3–1 | 29 | 0 | 0 | 0 | 0 | W |
| 2026Jun 22 | Group stage |  Austria | 2–0 | 90 | 0 | 0 | 0 | 0 | W |
| 2026Jun 17 | Group stage |  Algeria | 3–0 | 90 | 0 | 0 | 2 | 1 | W |
| 2022Dec 18 | Final |  France | 3–3Won on pens | — | 0 | — | — | — | W |
| 2022Dec 13 | Semi-final |  Croatia | 3–0 | — | 0 | — | — | — | W |
| 2022Dec 9 | Quarter-final |  Netherlands | 2–2Won on pens | — | 0 | — | — | — | W |
| 2022Dec 3 | Round of 16 |  Australia | 2–1 | — | 0 | — | — | — | W |
| 2022Nov 30 | Group stage |  Poland | 2–0 | — | 1 | — | — | — | W |
| 2022Nov 26 | Group stage |  Mexico | 2–0 | — | 0 | — | — | — | W |
1970–2022 appearances and goals: © 2023 Joshua C. Fjelstul, Ph.D. CC BY-SA 4.0. Adapted to site match IDs. Historical minutes, assists and shots are unavailable in this table; see Advanced analytics for covered editions.
Reconstructed from the substitution record, colour-coded by result
Solid bars are starts, outlined bars substitute appearances; the colour is the result and the rule marks 90 minutes. Bar position shows exactly when he was on the pitch.
Drawn against conceded, mirrored on a shared centre line
Where his tournament actually happened
StatsBombWorld Cup edition statistics · 2022. Only editions with event coverage are compared.
Totals per covered World Cup
Totals per covered World Cup
Totals per covered World Cup
Totals per covered World Cup
Totals per covered World Cup
Totals per covered World Cup
Source totals; unavailable measurements are not estimated
| Edition | Matches | Goals | Assists | xG | Shots | Passes | Pass % | Key passes | Pressures |
|---|---|---|---|---|---|---|---|---|---|
| 2022 | 6 | 1 | 1 | 0.50 | 7 | 271 | 89.3% | 7 | 70 |
Recorded on-ball event locations
594 events Attack →
On-ball events in the final third
236 events Attack →
Origins of passes that led to shots
7 events Attack →
Destinations of completed passes received
263 events Attack →
Carries advancing at least 10 pitch units
26 events Attack →
Duels, blocks, interceptions, clearances and recoveries
79 events Attack →
Where fouls against the player were recorded
18 events Attack →
All recorded shots · marker size reflects xG
7 shots · 1 goals Attack →
Compare the coverage behind these maps
StatsBomb2022 only. Locations are aggregated into 12 × 8 pitch zones; smoothing illustrates density, not a continuous player trail. No 2026 positional feed is loaded.
Every World Cup with a recorded appearance
Across every World Cup he has played
Recorded output against the 2026 field. These are statistical comparisons, not an editorial ability score or transfer valuation.
Per 90 minutes vs 189 players with 180+ minutes — the notch is the group median
1 scored · group median 0.0067th percentile
1 recorded · group median 0.0067th percentile
13 attempted · group median 1.1664th percentile
12 fouls drawn · group median 1.0866th percentile
9 conceded · group median 1.1052nd percentile
Every bar runs on the same 0–100 scale — how much of the group he finished ahead of. The notch is the halfway point, so a bar past it beats the median midfielders.
Against every player who took a shot
1 goals from 13 shots · field average 12%
4 of 13 on target · field average 34%
Minutes by recorded position
Historical appearances and edition counts: © 2023 Joshua C. Fjelstul, Ph.D. CC BY-SA 4.0. Adapted by grouping appearances and linking match IDs. Methodology and coverage
Every 2026 figure here comes from completed match reports: goals, assists, shots, fouls, cards and team sheets. Minutes played are reconstructed from the substitution record for each match.
The loaded 2026 reports do not include per-player passes, tackles, interceptions, expected goals or event coordinates — the advanced analytics tab is StatsBomb event data for 2022 and is labelled as such. Club-season estimates and editorial scouting ratings are never shown. How this data is compiled.